Whether you are a Linux enthusiast or a system administrator, we all share a common concern about what’s happening under the hood of our Linux system/server.
In this blog, we will explore a selection of both GUI and CLI tools that will help you monitor your system’s resources, performance, and health.
Without any further ado, let’s delve into the discussion about these system monitoring tools for your Linux system one by one.
Linux GUI System Monitoring Tools
These are some of the best GUI system monitoring tools for you if you are more of a GUI fan than CLI.
1. Default GNOME System Monitor
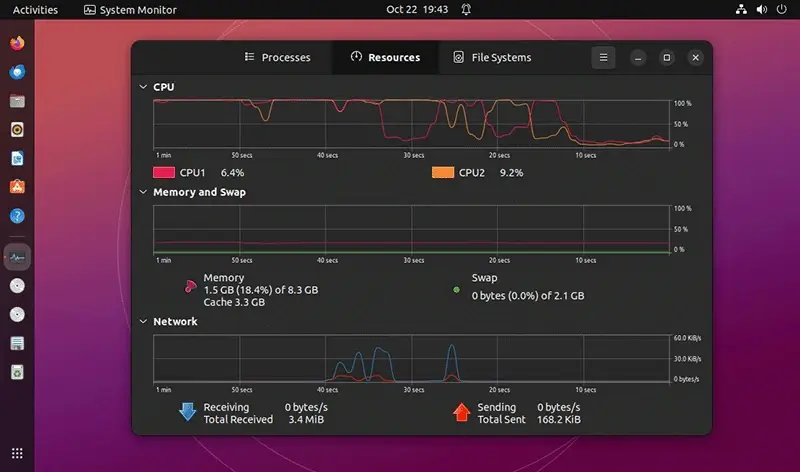
Why not begin our list of the best system monitoring tools with the GNOME System Monitor tool? It comes pre-installed on Ubuntu and many other Linux distros running the GNOME Desktop! It is a clean, simple, open-source tool that provides a high-level overview of your system’s performance.
The GNOME System Monitor tool not only aids its users in viewing but also controls the running processes. Additionally, it uses graphs and tables to display information about the usage of the system’s resources, including processor time, memory, disk space, CPU allocation, and more.
Key Features of GNOME System Monitor:
- Allow users to monitor, manage, and even terminate running processes.c
- A lightweight tool that consumes fewer system resources.
- Users can even sort processes and view individual process details.
- It offers a sneak peek into detailed information about your system’s hardware and software.
- It offers a real-time alert when specific resource thresholds are reached.
- Display the download and upload speed of the network.
- It even allows its users to save and load system monitor reports.
- It offers a UI categorized into different tabs, such as the Resources tab, Processes tab, and File Systems tab, to switch between distinct aspects of system monitoring.
While the GNOME System Monitor tool typically comes pre-installed, if it’s not available, you can easily install it using your system package manager as shown:
sudo apt install gnome-system-monitor         [On Debian, Ubuntu and Mint]
sudo yum install gnome-system-monitor         [On RHEL/CentOS/Fedora and Rocky/AlmaLinux]
sudo emerge -a sys-apps/gnome-system-monitor  [On Gentoo Linux]
sudo apk add gnome-system-monitor             [On Alpine Linux]
sudo pacman -S gnome-system-monitor           [On Arch Linux]
sudo zypper install gnome-system-monitor      [On OpenSUSE]
2. Resources
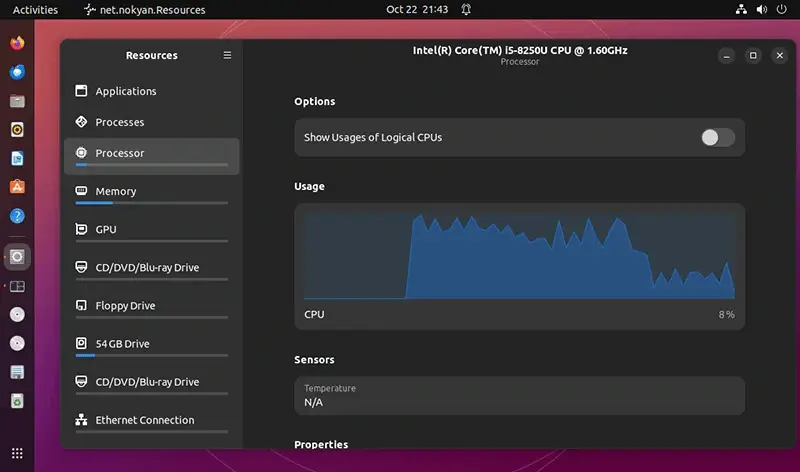
Moving onwards with the list, let’s not miss the latest GUI system monitoring tool which is known as “Resources” (popularly known as “Rust-based Resources”), which is a simple, modern yet powerful and versatile tool that offers a graphical overview of your system’s CPU, memory, GPUs, and disk usage.
Additionally, users can also list and terminate running processes as well as graphical applications. It is developed in Rust programming language and relies on GTK 4 and libadwaita for its GUI.
Key Features of Resources:
- Users can view sortable and searchable lists of running applications and processes.
- Users can customize the appearance of the Resources window.
- It is developed in Rust which is a relatively modern language best known for its high performance.
- Additionally, you can monitor network activity, system temperature, and fan speed.
- It offers the ability to monitor network activity, system temperature, and fan speed.
- You can monitor the usage of core system components through real-time graphs.
Despite the above-listed features, Resources tool also offers additional features that you can enjoy by installing it on your system by executing the command mentioned below.
flatpak install flathub net.nokyan.Resources
flatpak run net.nokyan.Resources
3. Stacer
Stacer is not only a modern GUI system monitoring tool but also a Linux optimizer with an impressive user interface. It is an open-source tool that allows its users to monitor their system’s CPU, memory, disk, and network usage through interactive real-time graphs.
You can even locate a specific process and sort running processes using their PIDs (Process IDs).
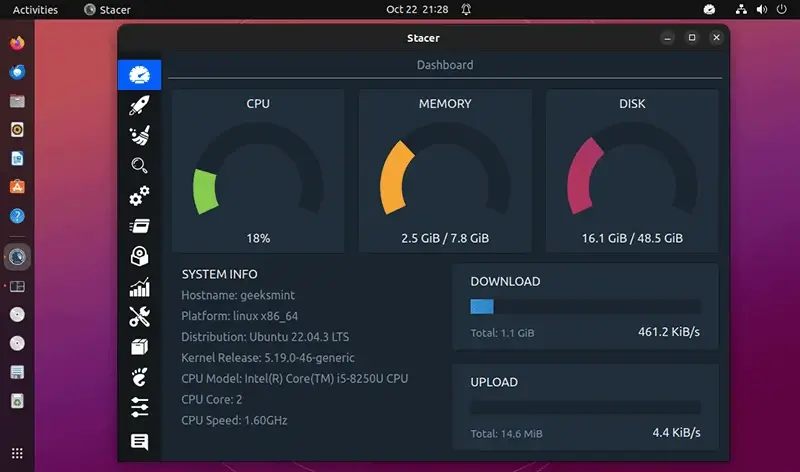
Apart from system monitoring functionalities, Stacer offers optimization features, including startup App management, system cleaning, service management, and package repository management.
To install Stacer in your Linux system, execute the following command.
sudo apt install stacer         [On Debian, Ubuntu and Mint]
sudo yum install stacer         [On RHEL/CentOS/Fedora and Rocky/AlmaLinux]
sudo emerge -a sys-apps/stacer  [On Gentoo Linux]
sudo apk add stacer             [On Alpine Linux]
sudo pacman -S stacer           [On Arch Linux]
sudo zypper install stacer      [On OpenSUSE]
Linux CLI System Monitoring Tools
If you are like me and the majority of other Linux users who love to use the CLI over GUI, let’s explore some of the best CLI system monitoring tools.
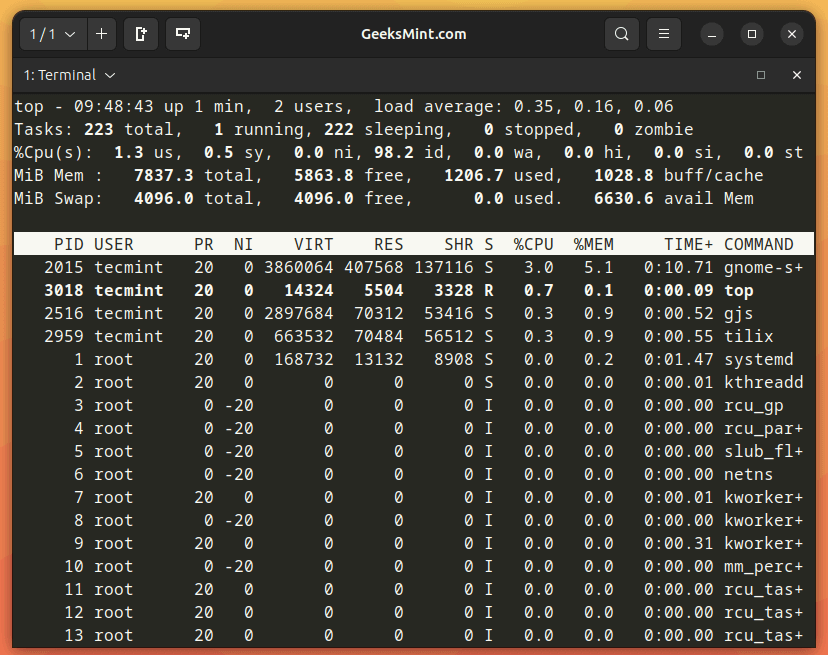
However, before we begin this list, we should discuss a fundamental Linux command known as the “top” command because most of the tools we are going to discuss rely on the “top” command for their core functionality.
The top command displays all currently running processes on your system.
top
This section explores a selection of CLI system monitoring tools for Linux, demonstrating their utility and how to install and use them effectively.
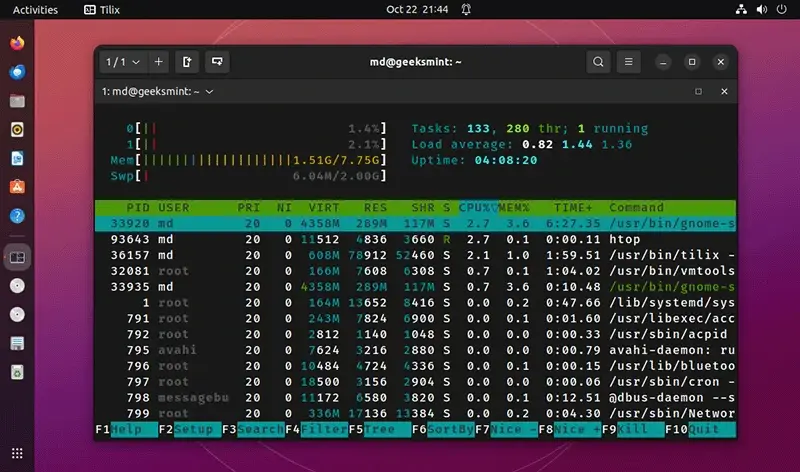
4. Htop
Htop is an interactive text-based process viewer that supports Linux and other Unix-like operating systems. It is a more advanced alternative to the top command that offers additional features for monitoring system resources and managing processes.
Key Features of Htop:
- Ability to sort and filter processes.
- Real-time monitoring of the system’s resource usage, such as CPU, memory, swap, disk, and more.
- Ability to prioritize processes and even terminate the running processes.
- Allows users to scroll in both horizontal and vertical directions to view the list of processes and the full command line.
- Customizable appearance.
- Supports both keyboard and mouse interaction.
To enjoy the htop utility on your Ubuntu, you can install it by running the following command.
sudo apt install htop         [On Debian, Ubuntu and Mint]
sudo yum install htop         [On RHEL/CentOS/Fedora and Rocky/AlmaLinux]
sudo emerge -a sys-apps/htop  [On Gentoo Linux]
sudo apk add htop             [On Alpine Linux]
sudo pacman -S htop           [On Arch Linux]
sudo zypper install htop      [On OpenSUSE]
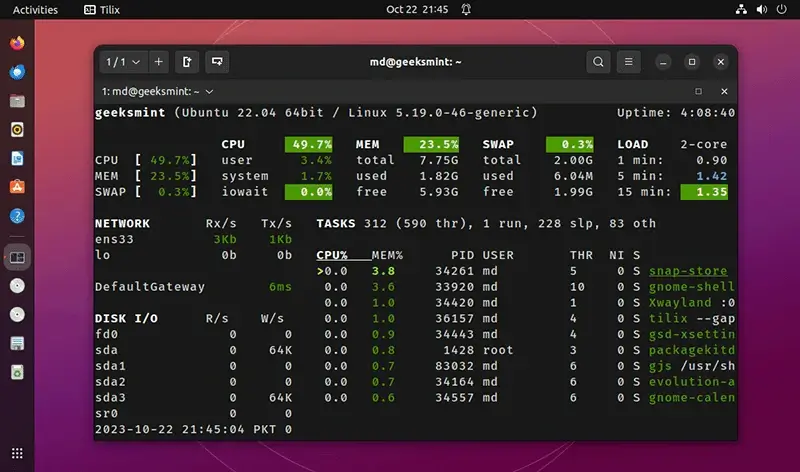
5. Glances
Glances is a cross-platform system monitoring tool that helps monitor all aspects of a system. It is a free, curses-based command-line tool that supports multiple monitoring modes, including standalone, client/server, and web server modes.
Many server administrators prefer Glances over alternatives like htop or top because of these reasons:
- Offers a web interface and an API to remotely monitor systems.
- Highly customizable.
- Ability to monitor fan speed and hardware temperature.
- Automatically adjusts its output depending on terminal size to enhance the user experience.
- Ability to export the system’s statistical data to various formats, like CSV, XML, or JSON.
You can enjoy htop powerful tool on your Linux by executing the command stated below:
sudo apt install glances         [On Debian, Ubuntu and Mint]
sudo yum install glances         [On RHEL/CentOS/Fedora and Rocky/AlmaLinux]
sudo emerge -a sys-apps/glances  [On Gentoo Linux]
sudo apk add glances             [On Alpine Linux]
sudo pacman -S glances           [On Arch Linux]
sudo zypper install glances      [On OpenSUSE]
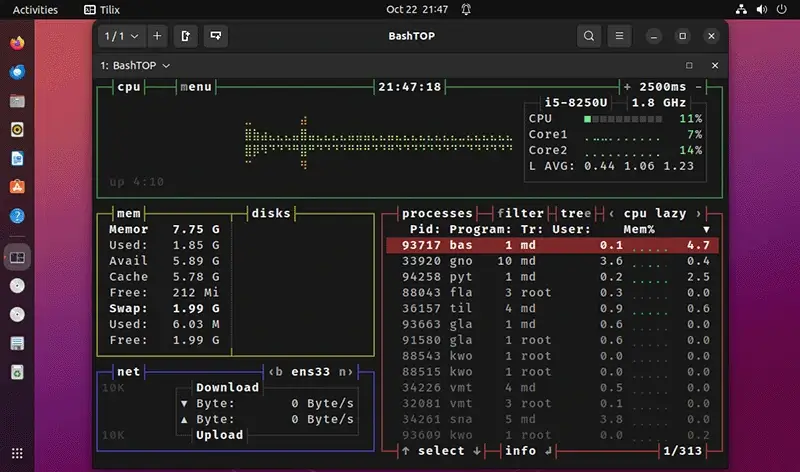
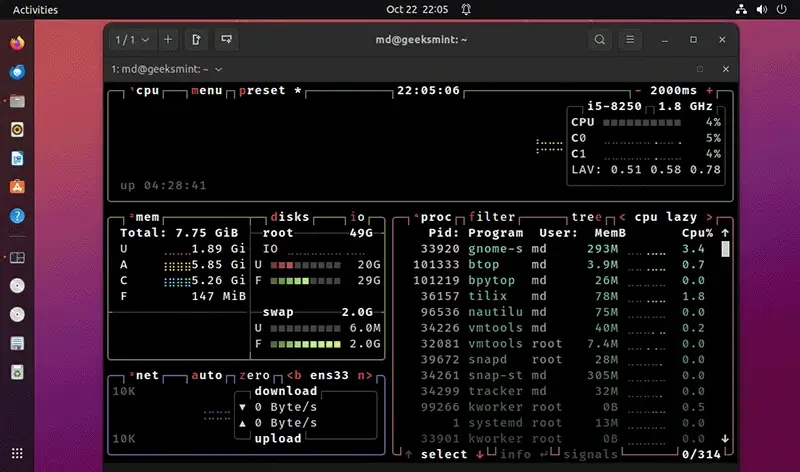
6. BashTop
BashTop is a simple, lightweight, and easy-to-use CLI system monitoring tool that returns an attractive GUI-like output. It is a variant of top command that can easily be considered the best among its peers, despite having a relatively slower speed than top and htop.
It offers numerous useful features, including monitoring resource usage, search and management of processes, a tree view of processes, and the ability to send SIGKILL, SIGTERM, and SIGINT signals to selected processes.
To install bashtop on Linux, run:
sudo apt install bashtop         [On Debian, Ubuntu and Mint]
sudo yum install bashtop         [On RHEL/CentOS/Fedora and Rocky/AlmaLinux]
sudo emerge -a sys-apps/bashtop  [On Gentoo Linux]
sudo apk add bashtop             [On Alpine Linux]
sudo pacman -S bashtop           [On Arch Linux]
sudo zypper install bashtop      [On OpenSUSE]
7. Gotop
Gotop is a flashy terminal-based graphical activity monitor developed using the Go language. It was inspired by other utilities like gtop and vtop, which are themselves variants of the top command.
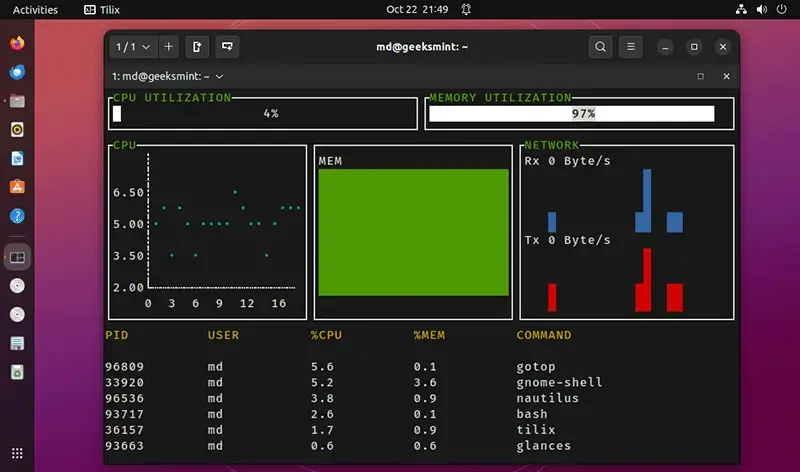
Gotop tool offers a ton of customization options and supports both Linux and macOS platforms. Additionally, it enables users to monitor their CPU usage, network usage, process list, CPU temperature, and disk usage.
To install gotop on Linux, run:
sudo snap install gotop
8. atop
atop is a powerful full-screen performance monitor tool for Linux that aids users in monitoring system resources and processes in an interactive manner. It is an ASCII-based tool that displays the resource consumption of all processes. Furthermore, it even indicates which processes are responsible for the indicated load.
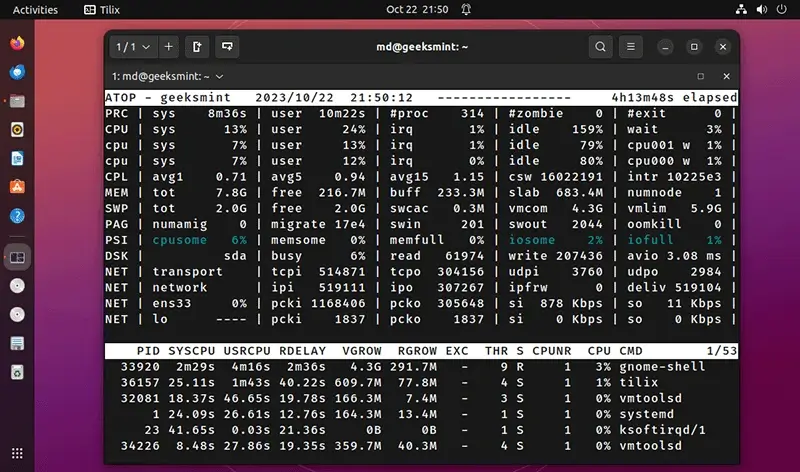
The atop has the ability to send alerts when specific system thresholds are exceeded. Additionally, it’s worth noting it’s one of the few system monitoring tools that can log historical data.
To install atop in your Linux system run the command mentioned below:
sudo apt install atop         [On Debian, Ubuntu and Mint]
sudo yum install atop         [On RHEL/CentOS/Fedora and Rocky/AlmaLinux]
sudo emerge -a sys-apps/atop  [On Gentoo Linux]
sudo apk add atop             [On Alpine Linux]
sudo pacman -S atop           [On Arch Linux]
sudo zypper install atop      [On OpenSUSE]
9. nmon
Nmon (abbreviation for “Ngel’s performance Monitor”) is a powerful system monitoring tool originally developed by IBM for the AIX OS but now also supports Linux.
It enables its users to monitor the usage stats of CPU, memory, disk space, network, top processes, resources, virtual machine, power micro-partition, and other aspects of your Linux system in a single, concise view.
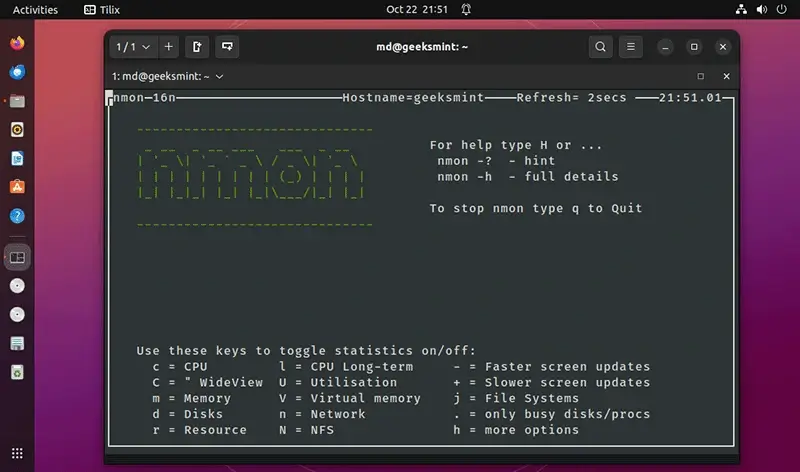
Nmon for Linux is an open-source tool that consists of a single code file containing 5000 lines and a makefile. This tool offers two runtime modes:
- Online Mode – It utilizes curses that aid in real-time monitoring and displaying stats in a condensed format.
- Capture Mode – It stores data in a CSV file for later processing and graphing.
To install Nmon in your Linux system run the command mentioned below:
sudo apt install nmon         [On Debian, Ubuntu and Mint]
sudo yum install nmon         [On RHEL/CentOS/Fedora and Rocky/AlmaLinux]
sudo emerge -a sys-apps/nmon  [On Gentoo Linux]
sudo apk add nmon             [On Alpine Linux]
sudo pacman -S nmon           [On Arch Linux]
sudo zypper install nmon      [On OpenSUSE]
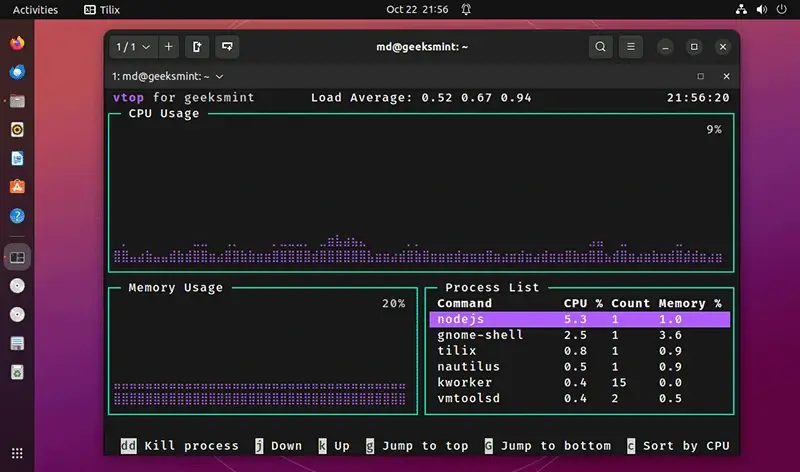
10. vtop
vtop is a fancy interactive open-source system monitoring tool written in Node.js. Despite managing the system’s resource usage, it is specifically designed to monitor CPU usage in multithreaded applications.
vtop uses Unicode braille to display fancy graphs of CPU and memory usage. Furthermore, it supports mouse and various themes like brew, gooey, monokai, parallax, wizard, and more. By using these themes, you can easily customize the appearance of your tool and even disable mouse support according to your preference.
To install vtop on your Linux system, you must have Node and NPM packages. After installing both of these packages, run the command stated below to install vtop.
sudo npm install -g vtop
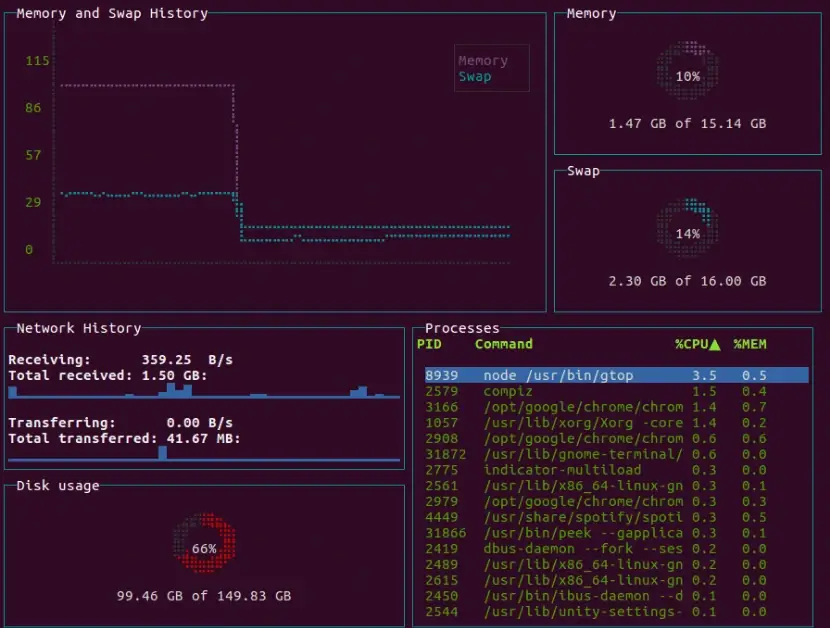
11. gtop
Gtop is a more user-friendly alternative to traditional command-line system monitoring tools, such as top and htop. It is an open-source, powerful tool that helps in monitoring system resources, including processes, sensors, disk I/O, network traffic, CPU, and memory usage, through an interactive dashboard.
gtop is developed in Node.js, so you need to have Node and NPM installed before installing this tool using the following command.
sudo npm install -g gtop
12. bpytop
bpytop is derived from bashtop and has been rewritten in the Python language with additional features.
Let’s jot down some of the features that are offered by bpytop:
- Full mouse support to interact with the tool.
- Supports a mini mode to display a condensed version of results.
- More frequent updates than bashtop.
- Support Linux and macOS.
- Offers a built-in help system.
- Advanced charting and monitoring.
- Supports multiple languages.
- Improved performance.
- Responsive UI.
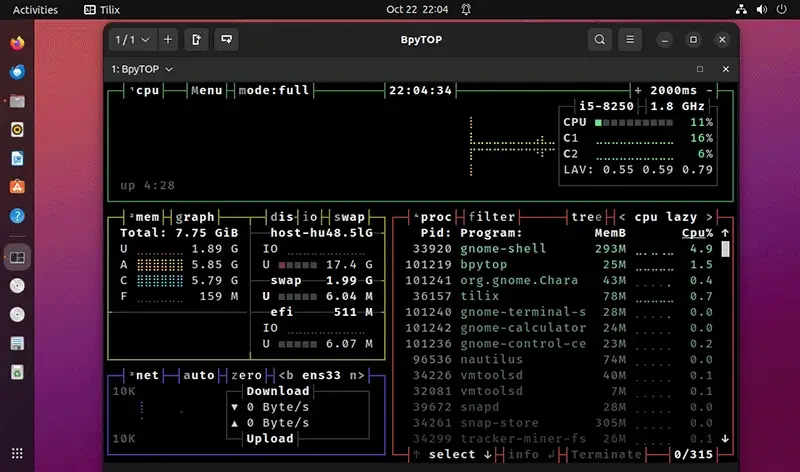
bpytop tool will allow you to monitor and manage your system’s resource usage and even help you in sending signals like SIGKILL to specified processes.
To install it in your system, ensure that your system contains “pip3”. After that, you can run the command given below to install and enjoy bpytop:
sudo pip3 install bpytop
13. btop
btop is a continuation of the bashtop and bpytop system monitoring tools and is developed in C++. It is an open-source, powerful tool with a game-inspired modern interface for its menu.
It offers all the features that were offered by both its predecessors. However, let’s list some of the additional features this tool contains to offer its users:
- Enable GPU usage monitoring.
- Support for more sensors like Hardware temperature.
- More comprehensive process information.
- Powerful sorting and filtering options for processes.
- Highly customizable interface.
To install btop on your Linux, simply execute the command mentioned below:
sudo snap install btop
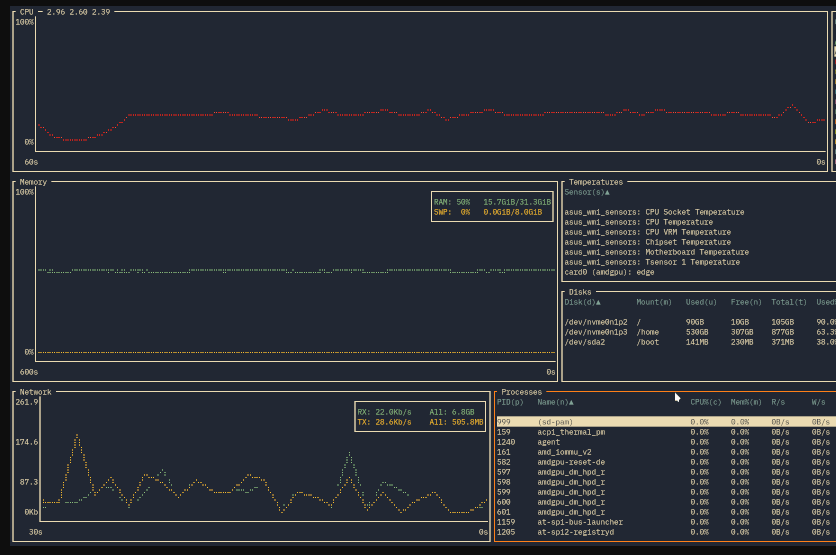
14. Bottom
bottom is a customizable cross-platform graphical process/system visualization and management tool for the Linux terminal that is inspired by other tools like gtop, gotop, and htop.
To install bottom on your Linux, simply execute the command mentioned below:
sudo snap install bottom
Conclusion
Deciding which is the best system monitoring tool for your system is entirely a matter of personal choice. If you want a simple tool, you can opt for GNOME System Monitor, but if you wish to use a powerful tool with rich features, use htop or glances.
You can even choose any other of the above-listed tools, as each of them offers unique features.
For me, the best one is bottom monitoring tool, which is a cross-platform graphical process/system monitor for the terminal.